Before using your data layers (hazard and exposure) in InaSAFE certain preprocessing are needed such as attribute and format conversions. This will ensure that the layers and its values are correct in order to provide a reliable result.
Plugins ‣ Manage and install plugins...
Type fTools on the search bar then enable.
Load your layer .
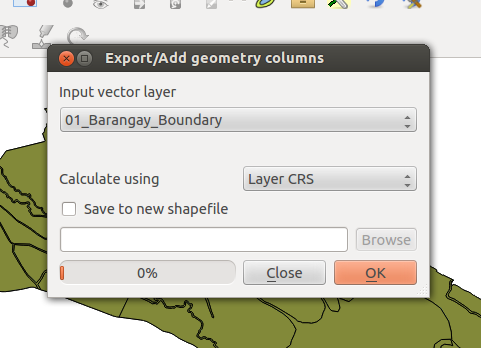
| menuselection: | Vector –> Geometry Tools –> Export/Add geometry columns |
|---|
Choose where layer will the Area and Perimeter data be added. Choose Layer CRS for calculation.
Note
Make sure that your layer has a correct CRS before choosing Layer CRS for calculation.
Now that we have a population and area on our data we’re going to add a new column for population density.
On Open Attribute Table click  then
then  .
.
On Output field name Add name for population density (e.g., popden).
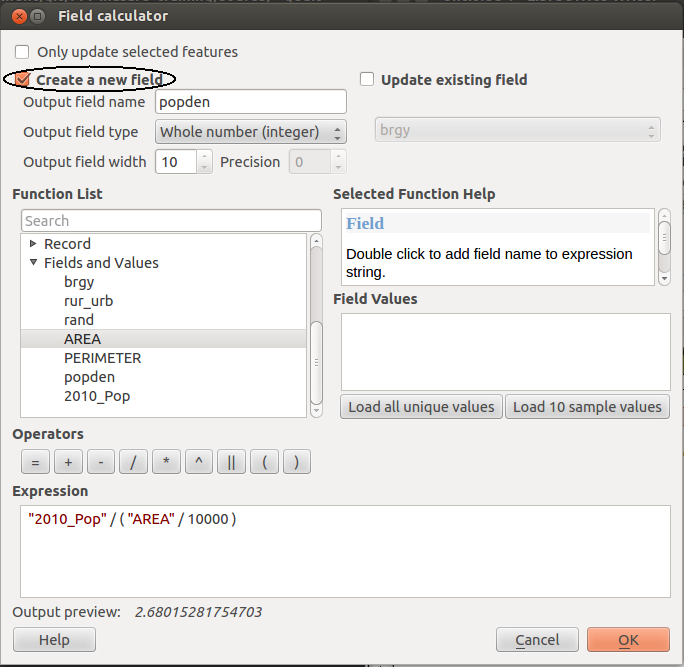
Add this formula on ‘Expression’ Population / (Area/10000)
To do that:
 and click .
Right click your Flood layer, then select Open Attribute Table.
Click .
Sort your data by clicking the field name:
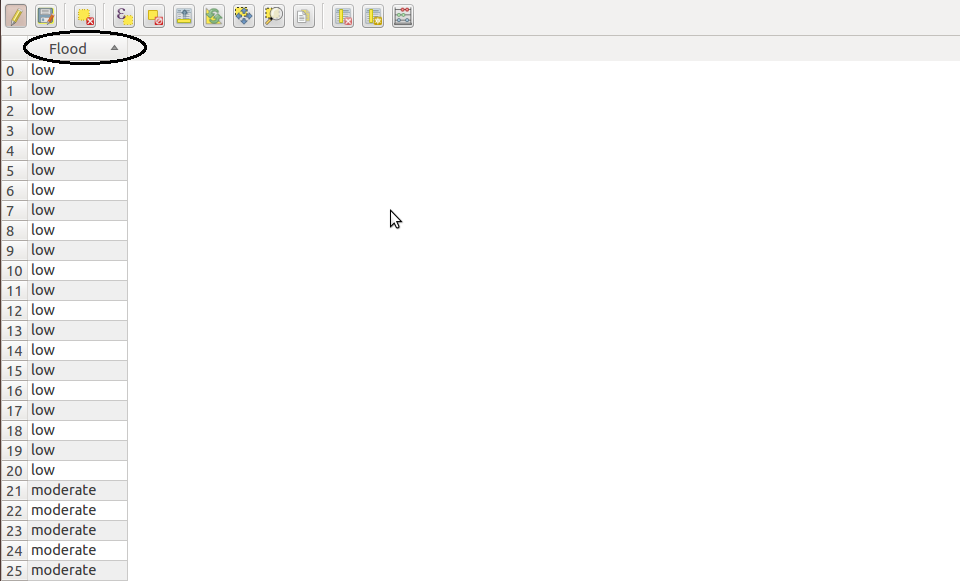
Selecting by group of data by clicking on the row number Shift (Keyboard) up to the last data.
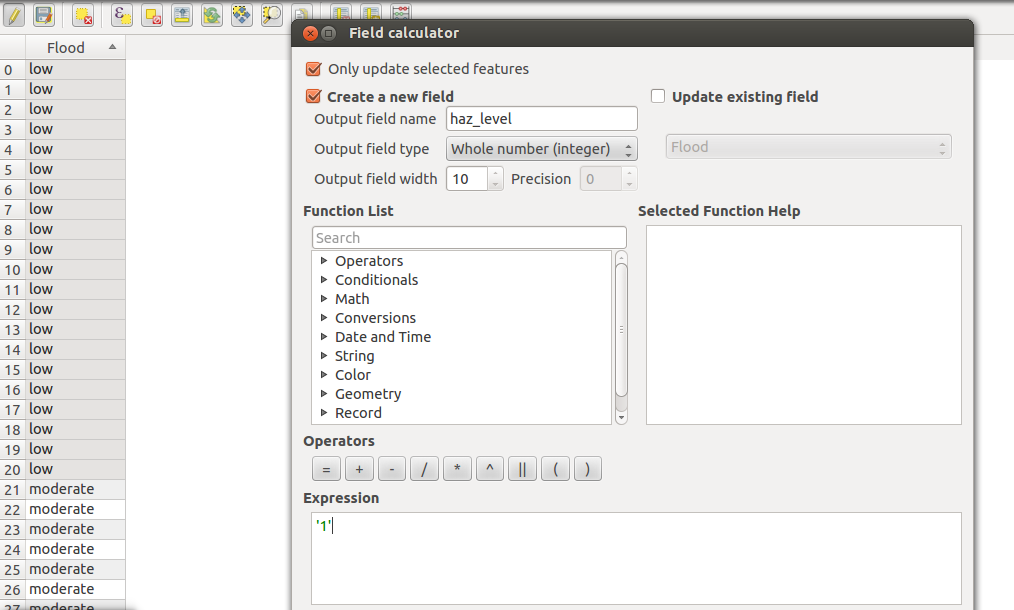
Click .
Since we’re going to make a new field, check Create a new field.
On Output field name Add name for hazard level (e.g., haz_level).
Set Expression according to your flood data.
Now that we already have a field for numerical hazard data, on Field Calculator check Update existing field.
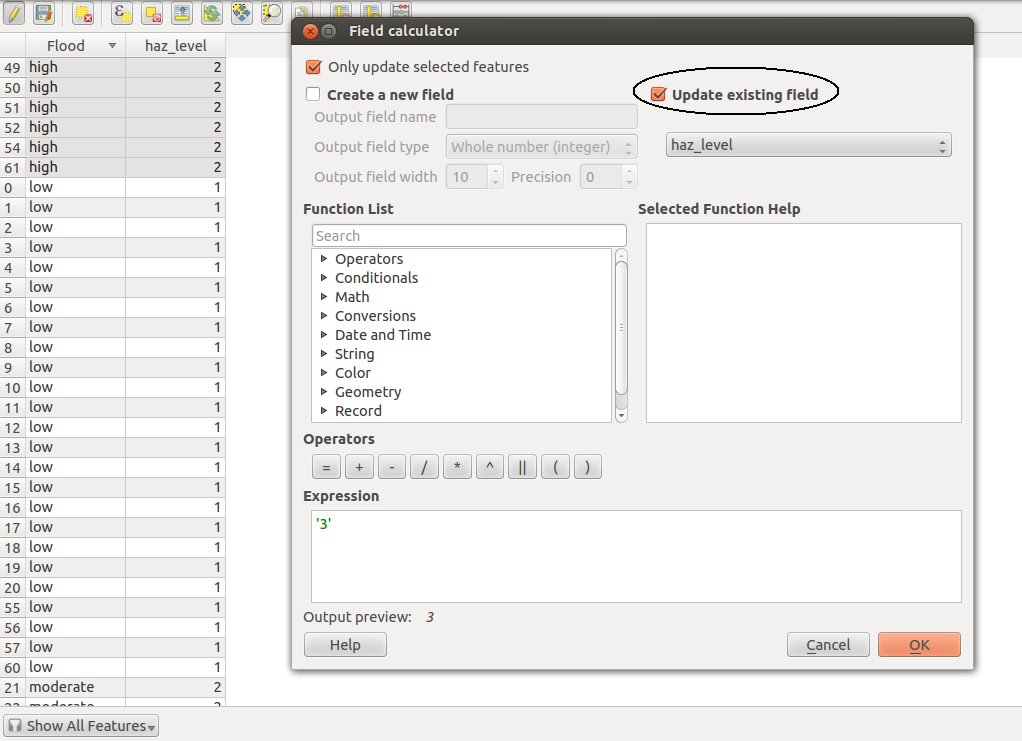
Click, OK, Save and click .
Population Density
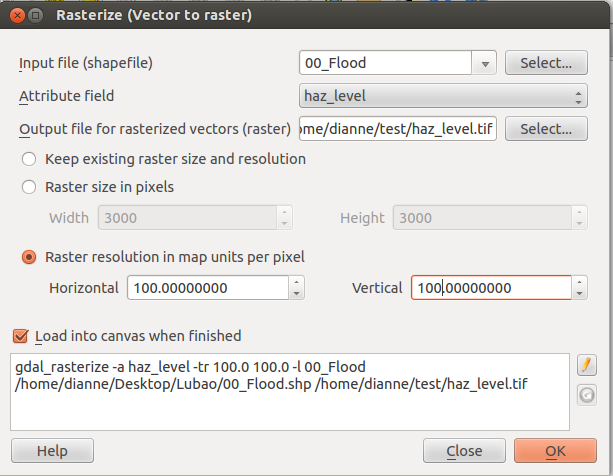
Raster ‣ Conversion ‣ Rasterize.
On `Input file (shapefile) select vector layer to be rasterize.
On Attribute field field name of Population Density to be rasterize.
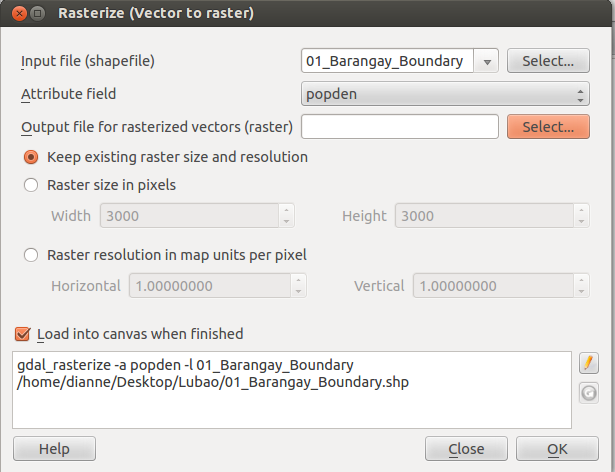
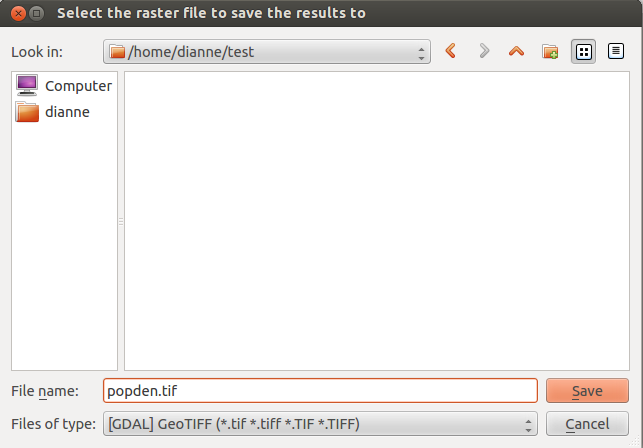
On Output file for rasterized vecto(raster) click Select button.
Choose file path for saving the raster, add name select .TIF as image format then Save.
6. Click Raster resolution in map units per pixel. Set the Horizontal and Vertical to 100.
Warning
Look out for the OK button you’re clicking you may duplicate creating raster layer.
Flood
Same instruction for Population Density. Just change layer name and attribute field like this:
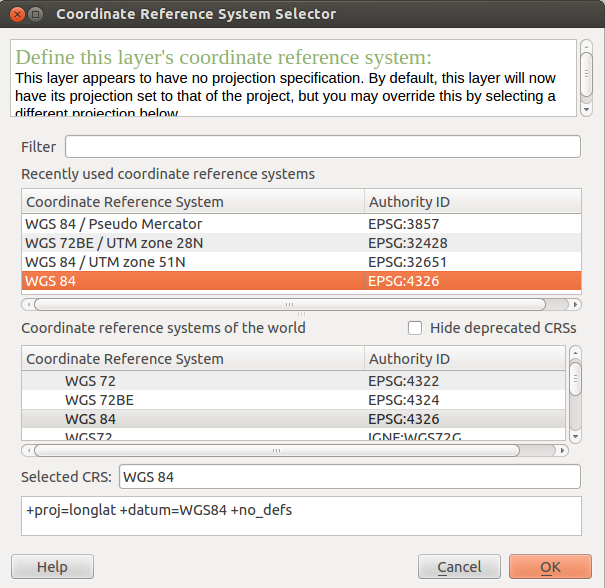
We’re going to set your projection to WGS 84 because it is the default projection which InaSAFE can recognize.
Right click on raster layer.
Select Save as...
Browse where to save raster layer. Then save as .tif file.
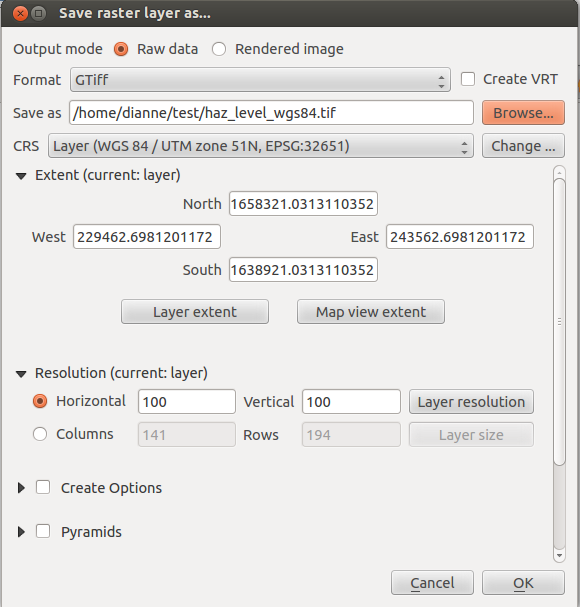
Change then Choose WGS 84 as CRS.
Click OK.
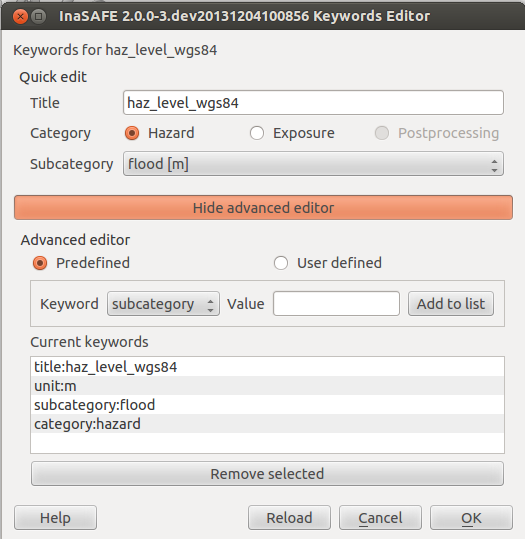
Hazard
Keyword: subcategory Value: flood Keyword: unit Value: m
Add to list then OK
Note
We’re just trying to demo how your data will work on InaSAFE. 1m, 2m, 3m are not representing Low, Moderate and High. Better if you input your flood depth in meters at Attribute Table. Categorical hazard data are still on development. We will update you once it is done.
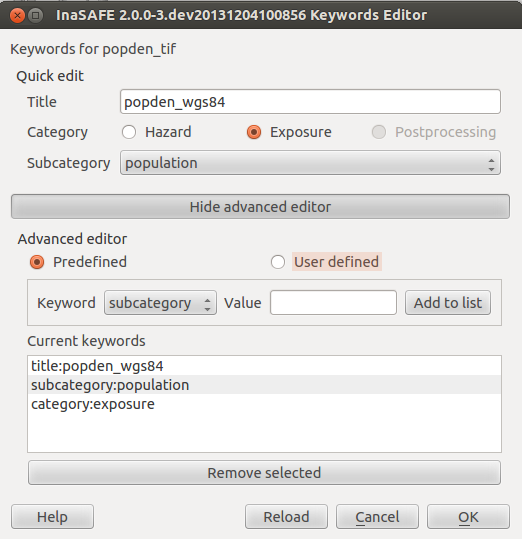
Population
Keyword: subcategory Value: population
Add to list then OK
Aggregation
Select your Administrative Boundary layer which is vector
Click Keyword Editor ![]()
Select Postprocessing
Set Aggregation attribute as Barangay
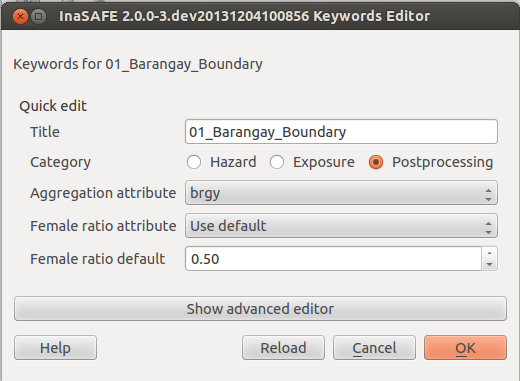
Click OK
Click Run